
UCO BI
A powerful BI platform for processing large volumes of corporate data and visualizing it as interactive dashboards. Make informed strategic decisions based on accurate figures, not intuition.
Download Presentation
What Problems Does UCO BI Solve?
The lack of unified analytics leads to delayed decisions and lost competitive advantages. Here are the core challenges we address:
Data Scattered Across Multiple Databases
Sales info in CRM, finance in 1C, and inventory in Excel. Manual data consolidation wastes time and leads to human errors. UCO BI consolidates all sources into a single dashboard.
Reports Become Obsolete Before Reading
Compiling monthly reports takes 5 to 10 days after the month ends. Executives see outdated data. UCO BI dashboards update in real time automatically.
Difficulty in Finding Deviations Root Cause
Static PDF reports do not reveal why sales dropped. Our interactive Drill-down interface lets you navigate from high-level metrics down to specific invoices in just one click.
Functional Modules
Interactive Dashboards
Flexible analytic panels supporting drill-down paths, instant filters, and slices configuration on the fly for rapid visual analysis of key performance indicators.
Consolidating Data Sources
Direct integration with relational databases (PostgreSQL, Oracle, MSSQL), ERP, CRM, 1C platforms, local Excel/CSV files, and external web APIs.
Trend Forecasting
Smart predictive engines built from historical data. Identify seasonal variations, operational bottlenecks, anomalies, and potential financial risks.
Automated Report Distribution
Configure systematic reports (PDF/Excel) emailed to executives. Trigger real-time notifications for metric deviances.
Business Value & ROI
UCO BI implementation makes operations transparent and manageable for company owners and executives:
Integration Blueprint
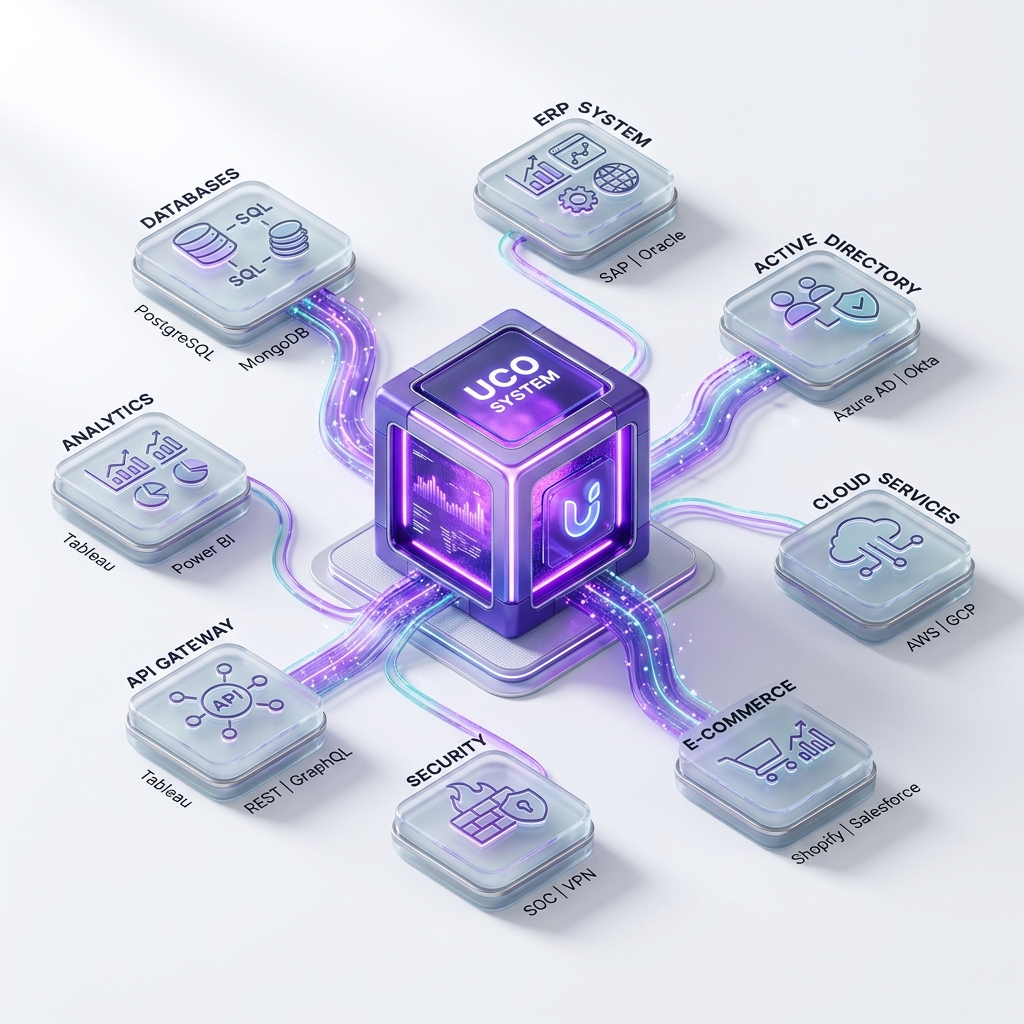
The BI platform functions as an analytical overlay across all your transactional systems:
Real-Time Data Synchronization
The UCO architecture supports secure integration with all key enterprise IT systems through modern interfaces:
- ERP & Accounting: Two-way synchronization with 1C:ZUP, 1C:ERP, and SAP HR.
- Directory Services: Single Sign-On (SSO) and employee credentials via Active Directory / LDAP.
- External Platforms: Connections with access control systems, healthcare portals, job boards (hh.ru), and digital signatures.
Frequently Asked Questions (FAQ)
Common questions about our BI system deployment: